File:5-1yield.png: Difference between revisions
Jump to navigation
Jump to search
This plot of yield vs. pressure, at the different levels of temperature, helps to visualize the different effects in our problem. |
(No difference)
|
Latest revision as of 12:01, 31 July 2010
This plot of yield vs. pressure, at the different levels of temperature, helps to visualize the different effects in our problem.
File history
Click on a date/time to view the file as it appeared at that time.
| Date/Time | Thumbnail | Dimensions | User | Comment | |
|---|---|---|---|---|---|
| current | 12:01, 31 July 2010 | 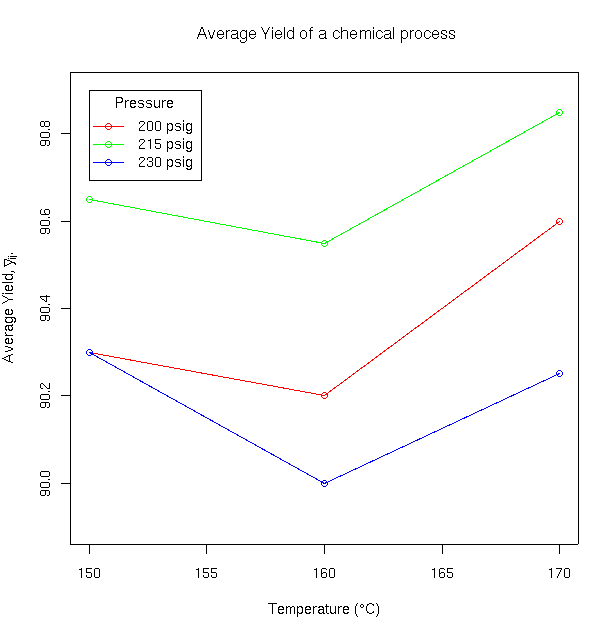 | 614 × 634 (9 KB) | Statadmin (talk | contribs) | This plot of yield vs. pressure, at the different levels of temperature, helps to visualize the different effects in our problem. |
File usage
The following page uses this file: